Evaluating Vibration Fatigue Correctly - Why Components Fatigue
Niels Kuhn
03.03.2026
TechArticle 26/3 | How Different Load Types Influence Fatigue Strength
Why do certain frequencies cause damage so quickly? In automotive engineering, components must withstand real vibration loads. Tests such as a PSD profile according to VW 80000 evaluate resistance to typical failure mechanisms such as delamination and material fatigue. Simulations provide the same proofs significantly faster – and reveal which frequencies truly fatigue the component.
Liquid‑Cooled Control Unit | © CADFEM / Adobe Stock / ID: OTQQKP
Summary
-
Why are vibration loads critical? Vibration excitations – whether random, sinusoidal, or shock‑like – can excite a structure’s natural modes at critical frequencies and thereby lead to high stress levels that may cause damage.
-
How can critical frequencies and hotspots be identified? Only through a fatigue analysis that determines stresses and cycle counts can critical frequencies at a specific geometric location be identified.
-
How can fatigue strength be assessed across different load types? Ansys nCode DesignLife can combine various FE results (e.g., vibration loads with a static load case) in a single event. Multiple events can then be grouped into a duty cycle.
Why Resonance Destroys Components
Manufacturing a component and performing physical tests are cost‑intensive and time‑consuming. In addition, real tests often only deliver the simple result “passes” or “fails”. Simulation can significantly reduce both development time and costs. It also reveals the root causes of potential failures so that optimization measures can be derived more efficiently. To illustrate a typical fatigue verification under vibration excitation, a water‑cooled electronic control unit is considered.
Repeated loads lead to cyclic stress and thus to material fatigue. Test standards (e.g., ISO 167503 and VW 80000) define load signals based on frequency content and amplitudes. With increasing frequency, component life decreases because the number of cycles per unit time increases. If the excitation frequency lies in the range of a natural frequency, resonance occurs. This increases both deflection and stress, reducing the lifespan further. VW 80000 also includes temperature cycles that influence fatigue life.

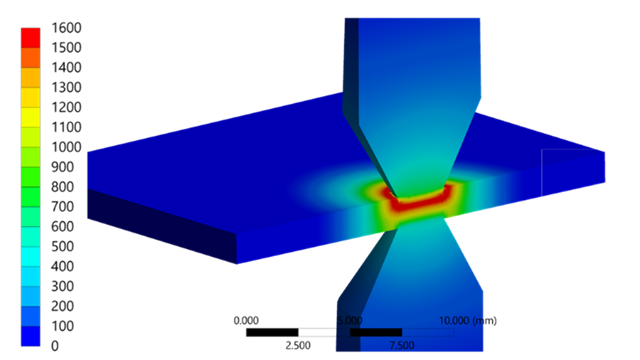
Stresses at Different Frequencies and the Corresponding Cycle Counts | © CADFEM / ID: YTOGTV / EZED1U
Load inputs can be represented as time signals, e.g., acceleration over time. A Fourier transform decomposes this signal into sine components of different frequencies. The resulting power spectral density (PSD) shows which frequencies contain how much energy and which vibration components make up the original signal. As an example, we consider a water‑cooled ECU on a testbench subjected to a Random Vibration Test according to VW 80000 with a PSD profile from 20–2,000 Hz, typical levels, and temperatures from –25 °C to +100 °C – with the objective of meeting the release criteria for vibration fatigue.
Analyses for a Vibration Fatigue Assessment
Once the fundamental fatigue mechanisms are understood, the next step is replicating the test specifications in simulation. Several analyses are required to evaluate fatigue strength using simulation: static structural analyses, modal analyses, and frequency‑domain analyses. For linear dynamics, the bolt preload contact condition is used as a restart point for the modal analysis. When calculating the modes, the contact condition is linearized, leading to a better representation of stiffness.
Code:
# import libraries
import os
from ansys.geometry.core import launch_modeler_with_discovery
# create string with discovery code
cmd = """
# fix Small Faces with a smaller width of 1.5 mm
FixSmallFaces.FindAndFix(FixSmallFacesOptions(Width=MM(1.5)))
# define variables
bending_face = None
z_bending_face = float('inf')
# loop through faces
for face in GetRootPart().Bodies[0].Faces:
# get z coordinates and shape
z_cordinates = face.EvalMid().Point.Z
shape = face.Shape.Geometry.ToString()
# get bending face on the bottom
if (shape.Contains("Cylinder")):
if(z_cordinates < z_bending_face):
z_bending_face = z_cordinates
bending_face = face
# […] identify other important faces (clamping faces for example)
# save the faces in named selections
Selection.Create(bending_face).CreateAGroup("bending_face")
# […] also save other faces in named selections
"""
# create a text file and input the discovery code
fd = os.getcwd()
path = os.path.join(fd, "discovery.py")
with open(path, "w", encoding="utf-8") as file:
file.write(cmd)
# start discovery, open the geometry and run the code
modeler = launch_modeler_with_discovery(product_version = 251, hidden = True)
design = modeler.open_file(os.path.join(fd,"geometry.step"))
modeler.run_discovery_script_file(os.path.join(fd,"discovery.py"))
# save the finished geometry and delete the code file
design.save(os.path.join(fd,"geometry_prepared.scdocx"))
modeler.close()
os.remove("discovery.py")
Code:
# import libraries
import os
import ansys.meshing.prime as prime
from ansys.meshing.prime.graphics.plotter import PrimePlotter
# start client and assign lucid meshing
prime_client = prime.launch_prime()
model = prime_client.model
mesh_util = prime.lucid.Mesh(model=model)
# define path to geometry
fd = os.getcwd()
input_file = os.path.join(fd," geometry_prepared.dsco ")
# create a surface mesh
mesh_util.read(file_name=input_file)
mesh_util.surface_mesh(min_size=2.0)
# create a volume mesh and display
mesh_util.volume_mesh()
display = PrimePlotter()
display.plot(model, update=True)
display.show()
# save mesh
mesh_file_cdb = os.path.join(fd, "mesh.cdb")
mesh_util.write(mesh_file_cdb)

Contact Condition LS2 and Restart Settings of the Modal Analysis | © CADFEM / ID: 9B3Y59
Because the temperature changes during the application of the PSD spectrum, stress distributions at minimum and maximum temperature are also calculated and used as static loads in the vibration fatigue evaluation. Ansys nCode DesignLife reads the results of these analyses and composes them into a duty cycle. The entire test procedure is split into events to include temperature load case stresses. The customized Ansys nCode DesignLife workflow can be added to the Ansys Workbench toolbox as a template.
Defining Linear Dynamics Efficiently
For the vibration fatigue analysis in Ansys nCode DesignLife, transfer functions of the stresses are required – i.e., the structural response to a harmonic excitation of 1g over the considered frequency range. Ansys uses the Mode Superposition Method (MSUP), which employs the previously computed mode shapes and enables very fast harmonic analysis. For precise resolution around natural frequencies, frequency clustering is applied.

Transfer Function With and Without Clustering | © CADFEM / ID: 87OOY9
However, every single frequency point generates its own result set, creating two challenges:
- Stress evaluation dominates computation time (approx. 90% of total runtime).
- Result files can easily reach hundreds of gigabytes.
This effect worsens for components with many cooling fins, due to dense natural frequency spacing requiring many frequency points.
The solution:
Disable the stress output of the harmonic analysis. Instead of writing extensive stress fields, Ansys writes only the modal contribution factors to the compact MCF file. nCode can reconstruct the complete transfer functions using the modal stresses and modal contribution factors. Result: drastically reduced computation time and file size with no loss of accuracy. Additional advantage when using HPC Platform Services (HPS): the modal analysis is stored on the cluster and does not need to be retransferred. If enough compute capacity is available, all three spatial directions can be computed in parallel.
|
|
With creation of RST-file |
Without creation of RST-file |
|
|
|
|
|
Harmonic analysis computation time |
45 Min * 3 = 135 Min |
1 Min * 3 = 3 Min |
|
RST file size (harmonic analysis) |
121 * 3 = 363 GB |
0 GB |
|
Fatigue computation in nCode |
17 Min |
4 Min |
|
Calculated duty cycle repetitions |
36@Node164950 |
36@Node164950 |
Model with 1 million nodes and 23 modes in the evaluated frequency range. Comparison of File Size and Computation Times for a 3‑Axis Vibration Fatigue Analysis | © CADFEM Germany GmbH.
​Let’s Simulate: Betriebsfestigkeit​
CADFEM Mitarbeiter teilen ihr Expertenwissen zur Betriebsfestigkeit und zeigen, wie aussagekräftige Lebensdauerprognosen gelingen. Gratis-Preview holen!
Training: Strength Assessment with Ansys nCode DesignLife
In addition to the application of a range of calculation methods for durable design of mechanical components in Ansys nCode DesignLife, this training will also focus on the handling of long time series and load spectra.
Code:
# import libraries
import os
from ansys.dpf import core as dpf
# open result file
fd = os.getcwd()
model = dpf.Model(os.path.join(fd,"result.rst"))
# get results and mesh
results = model.results
mesh = model.metadata.meshed_region
# extract displacement results
displacements = results.displacement()
field = displacements.outputs.fields_container()
# export the displacement field
my_export = dpf.operators.serialization.vtk_export()
my_export.inputs.file_path.connect(os.path.join(fd,"displacement.vtk"))
my_export.inputs.fields1.connect(field)
my_export.inputs.mesh.connect(mesh)
my_export.run()
# shutdown all dpf servers
dpf.server.shutdown_all_session_servers()
Ansys Fluent GPU Performance Testing – Use Case
Ob im Maschinenbau, in der Luftfahrt oder bei der Produktentwicklung: Strömungssimulationen sind für präzise und schnelle Entwicklungsprozesse unerlässlich. Doch wie unterscheiden sich CPU- und GPU-basierte Simulationen, und was sind die wichtigsten Kriterien bei der Hardwarebewertung? Dieser Beitrag beleuchtet grundlegende Unterschiede, Leistungsmetriken und die Anwendungsmöglichkeiten von GPU- und CPU-Setups für Ihre CFD-Projekte.t
Calculating Damage with Ansys nCode DesignLife
After the transfer functions have been efficiently determined using the modal‑based harmonic analysis, they can be carried over directly into the fatigue life evaluation. For this purpose, Ansys nCode DesignLife uses an adapted nCode SN Vibration PSD Workflow, specifically designed for the modal‑based approach. The workflow imports both the modal RST file and the compact MCF files, and reconstructs the complete transfer functions from them. The associated PSD spectrum is defined directly within nCode, allowing the combined results from the modal and harmonic analyses to be used flexibly for different PSD profiles — provided that the frequency range of the PSD spectrum lies within the previously calculated transfer function range. The customized workflow is already integrated into the project’s toolbox and is therefore ready for immediate use.
For the fatigue life calculation, the following steps are carried out:
-
Importing the modal stresses: Ansys nCode imports the stresses from the RST file of the modal analysis, considering only the surface nodes.
-
Determining the transfer functions: For each excitation direction and for every node, the transfer functions are calculated by combining the modal stresses with the modal contribution factors.
-
Scaling with the PSD spectrum: The transfer functions are then scaled using the PSD spectrum defined in Ansys nCode, resulting in the PSD of Stress.
-
Determining the stress cycles: Based on the PSD of Stress, Ansys nCode generates a cycle histogram, typically using a distribution such as Lalanne or Steinberg.
-
Calculating the damage progression: Finally, the damage histogram is derived from the cycle histogram and the corresponding S‑N curve, quantifying the resulting fatigue damage.

Ansys nCode DesignLife Workflow | © CADFEM / ID: 76H5KO
Comparison of Results from Simulation and Shaker Test
Ansys nCode DesignLife provides, at the end of the workflow, both the damage per event and the allowable number of repetitions for the entire duty cycle. In the example, running all events through the workflow results in a total damage of D < 1 — meaning the component successfully passes the virtual system test. The evaluation also shows that the highest damage originates from excitation in the X‑direction. At the critical node, it becomes clearly visible which frequency contributes most significantly to the damage and thus plays a decisive role in determining the fatigue life. To validate these results, the control unit is subsequently subjected to a real shaker test. Comparing the frequency responses from the physical test and the simulation is essential to adjust the model to the actual boundary conditions.
Deviations often arise from modified mounting conditions, updated geometry versions, or differing damping values. Only through this correlation can the model and the real system be meaningfully aligned, allowing reliable conclusions to be drawn for future projects — a fundamental prerequisite for robust fatigue‑strength predictions

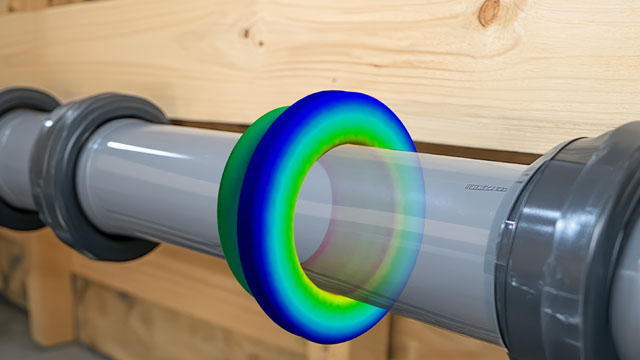
Result (Damage / X at Minimum Temperature) from nCode DesignLife in Mechanical and Comparison of FEM Results with Measurement | © CADFEM / ID: 4LEL7G
Those who want to carry out similar analyses reliably themselves benefit from a systematic approach to fatigue assessment - regardless of whether the load originates from random vibration, sinus sweeps, shock, or static alternating loads. In the training Strength Assessment with Ansys nCode DesignLife, we provide exactly this methodological foundation: how to apply transfer functions correctly, build fatigue life models cleanly, interpret damage results with confidence, and correlate test bench measurements with simulation results. The workflow presented here is only a starting point - in the training, you will learn the full range of Ansys nCode methods and apply them directly to your own questions.
More on the Topic
-
Training: Strength Assessment with Ansys nCode DesignLife

In addition to the application of a range of calculation methods for durable design of mechanical components in Ansys nCode DesignLife, this training will also focus on the handling of long time series and load spectra.
-
Let's Simulate - Fatigue strength

CADFEM employees share their expert knowledge on fatigue strength and show how to make meaningful service life predictions. Get your free preview!